Comprehensive list of FortiGate-specific CLI commands!
Here’s a comprehensive list of FortiGate-specific CLI commands categorized by common advanced troubleshooting tasks. These are used via the FortiGate console or SSH.
🔧 1. Basic System Information
get system status                # Shows firmware, serial number, mode, etc.
get system performance status    # Shows CPU, memory, sessions, etc.
🌐 2. Network & Interface Debugging
get system interface physical    # Shows physical interfaces and link status
diagnose ip address list         # Lists all configured IP addresses
diagnose netlink interface list  # Shows interface statistics
🔎 3. Policy & Session Debugging
diagnose firewall iprope show    # Show how traffic is evaluated by policies
diagnose debug enable
diagnose debug flow show console enable
diagnose debug flow trace start 100
diagnose debug flow filter addr x.x.x.x   # Filter by source/dest IP
# Useful for analyzing traffic path issues
🔐 4. VPN Troubleshooting
IPsec VPN
diagnose vpn tunnel list # Show active tunnelsdiagnose vpn ike gateway list # Show IKE Phase 1 detailsdiagnose vpn ike log-filter dst-addr4 x.x.x.xdiagnose debug application ike -1diagnose debug enable
SSL VPN
diagnose debug application sslvpn -1
diagnose debug enable
📊 5. Routing & Connectivity
get router info routing-table all       # Show all routing tables
execute ping x.x.x.x                    # Ping from FortiGate
execute traceroute x.x.x.x              # Trace route from FortiGate
🛠️ 6. Session Table
diagnose sys session list               # Full session table
diagnose sys session filter dst x.x.x.x
diagnose sys session clear              # Clear sessions if stuck
📦 7. Traffic Capture
diagnose sniffer packet any "host x.x.x.x" 4 100
# Captures traffic to/from specific host
🔐 8. Deep Inspection / Certificate Debug
diagnose debug application ssl -1
diagnose debug enable
🔄 9. High Availability (HA)
get system ha status                # View HA cluster status
diagnose sys ha checksum show      # Check config sync between units
diagnose sys ha history            # Shows failover events
🧰 10. UTM/Inspection Engine
diagnose test application ipsmonitor 1     # Test IPS engine
diagnose test application av 99            # Check antivirus status
Here is a step-by-step guide for troubleshooting common FortiGate firewall issues, using CLI commands and GUI suggestions. It’s categorized by real-world problems and includes commands, explanations, and tips.
🔧 Step-by-Step FortiGate Troubleshooting Guide
🛑 1. Internet Not Working Through Firewall
Step 1: Check Interface & IP
get system interface physical
diagnose ip address list
✅ Confirm WAN and LAN interfaces are UP and have IPs.
Step 2: Check Default Route
get router info routing-table all
✅ Ensure there’s a default route (0.0.0.0/0) via the WAN gateway.
Step 3: Ping from FortiGate
execute ping 8.8.8.8
✅ If this fails, your FortiGate may not have upstream internet access.
Step 4: DNS Test
execute ping google.com
❌ If IP ping works but not DNS, check:
show system dns
Step 5: Check Policy
Go to:
Policy & Objects > IPv4 Policy
✅ Ensure LAN > WAN policy exists and allows traffic.
🔐 2. VPN Not Connecting (IPsec)
Step 1: Check Tunnel Status
diagnose vpn tunnel list
Step 2: Enable Debug
diagnose vpn ike log-filter dst-addr4 <peer-ip>
diagnose debug application ike -1
diagnose debug enable
👁 Watch logs for negotiation errors (e.g., no proposal chosen).
Step 3: Common Fixes
- Match Phase 1/2 settings
- Confirm shared secret
- Check firewall policy (VPN zone > LAN)
🌐 3. Website or App Not Loading
Step 1: Check Policy Logs
GUI: Log & Report > Forward Traffic
Step 2: Test with Flow Debug
diagnose debug reset
diagnose debug enable
diagnose debug flow show console enable
diagnose debug flow filter addr <client-ip>
diagnose debug flow trace start 10
🔍 See which policy is matched or blocked.
Step 3: Application Control / Web Filter
GUI:
Security Profiles > Application Control / Web Filter
❌ Disable temporarily to test.
🔁 4. Traffic Not Reaching Server (e.g., Web Server in LAN)
Step 1: Check VIP / NAT
show firewall vip
Step 2: Check Firewall Policy
GUI: Policy & Objects > IPv4 Policy
✅ Ensure WAN to LAN policy exists with correct VIP.
Step 3: Monitor Logs
Use:
diagnose debug flow
Or GUI logs to verify if connection reaches internal server.
🔄 5. Sessions or Connections Drop Randomly
Step 1: Check Session Count
get system performance status
Step 2: Session Table
diagnose sys session list
Step 3: Check High Memory/CPU
diagnose sys top
🚨 If CPU > 90%, consider reducing UTM load or offloading SSL.
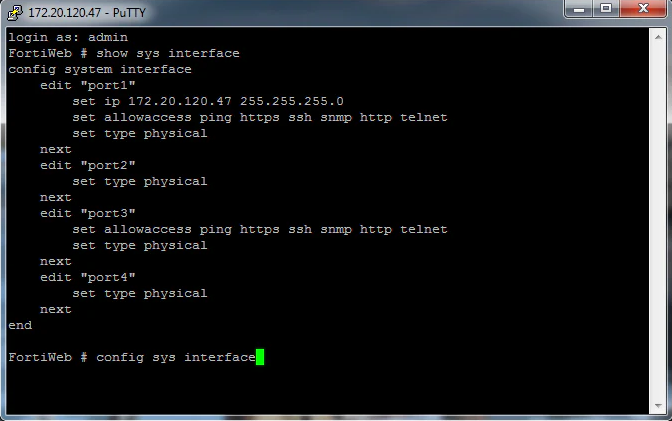
📶 6. FortiGate Web GUI Not Accessible
Step 1: Check Access Settings
show system interface
✅ Confirm set allowaccess http https ping ssh is set on LAN interface.
Step 2: Check Admin Lockout
diagnose sys lockuser list
Step 3: Console/SSH Access
If GUI fails, use SSH or console to reset settings.